Visualization architecture
Visualization in the platform is focused on a clear interface and a positive user experience.
Core ideas
User convenience (UI)
- Intuitive, modern UI
- Adaptation to the user's needs
- Easy migration from other platforms
User experience
- High quality of target projects
- High customer satisfaction
- Ease of use in business
Core integration
- Deep integration with the core
- Binding to the model-based architecture
- Binding to the reactive architecture
Data visualization
The visualization philosophy of the platform is split into two related domains: runtime environment components and development environment components.
Runtime environment
Contains the set of tools that users and operators need to control technological and production processes.
- HMI screens and widgets
- Controls
- Events, alarms and acknowledgement
- Trends and tools for working with time series
- Tables and reports
- Remote access tools
Development environment
Contains the set of tools that a developer needs to create and configure a project: data, logic and visual components.
- Editor for data, models and objects
- Scripting editors (core, Lua, TypeScript)
- Events and alarms editor
- Editor for components, HMI screens and widgets
- Data binding tools
- Driver configurator
Runtime environment
HMI screens
Designed for the schematic visualization of a technological and production process.
- Dynamic and static elements
- Built from standard and custom components
- Can contain widgets (a complex graphical element)
- Can include controls
- Can include alarms and trends
- Can include external components via iFrame and TypeScript
- Support for large monitors
- Support for a grid of several HMI screens
Events and alarms
Designed to display events and the alarm messages associated with them.
- Diagnostic messages
- Alarm messages
- Alarm acknowledgement functions
- Sorting of messages and alarms
- Sequential lists
- Cards with freeze
- Visual notification
- Audible notification
Trends
Designed for the visualization and analysis of technological and production processes.
- Line trends
- Markers and symbols
- Multiple trends on a single field
- Axis positioning
- Comparison of absolute trends
- Setpoints and alarm zones
- Discreteness and smoothing
- Dynamic control
Tables
Designed for analyzing data of technological and production processes in tabular form.
- Value changes over time
- Current values
- Consolidated comparison of variables
- Page-based pagination
- Sorting and search
- Working with the archive
- Quick export
- Report generation
Development environment
Enables the creation of complex interactive applications
Model editor
Designed for developing model structures.
- Creating a model structure
- Based on the simplest models
- Based on complex models
- Creating nesting
- Binding a graphical component
Object editor
Designed for developing objects.
- Creating an object structure
- Based on complex models
- Connecting data (drivers, simulation)
- Binding scripts (JS, Lua)
- Configuring a server for external access (OPC UA)
Graphics development environment
Enables the creation of modern graphics for embedded platform applications
Vector editor
Designed for creating complex vector graphics for HMI screens and building libraries of standard elements.
- Built-in native editor
- In-house development
- Creating components and standard elements
- Creating HMI screens and widgets
- Built-in data binding mechanism
- Built-in scripting editor
- Compatibility with the common vector format
Binding editor
Designed for integrating vector documents created in third-party mainstream editors.
- Compatibility with the common vector format
- Working with the SVG model (DOM)
- Configuring components and standard elements
- Configuring HMI screens and widgets
- Provides a data binding mechanism
- Provides a script embedding mechanism
- Such documents must be developed according to the guidelines
Which graphical elements and applications are available
The foundation of complex projects
Standard elements
Elementary graphical components.
- Small meaningful visual forms
- For example, a pump, valve, gate valve, tank
- Can be embedded into HMI screens
- Can be organized into libraries
Widgets
Small applications built from standard elements.
- Can be embedded into HMI screens
- Can be organized into libraries
- Can be exposed for external access
- For example, a trend or a valve control panel
HMI screens
A standard platform application.
- Built from components and widgets
- Can include static and dynamic elements
- Can perform command invocation functions
- Access to the platform API
Composites
An advanced platform application.
- Built from HMI screens and widgets
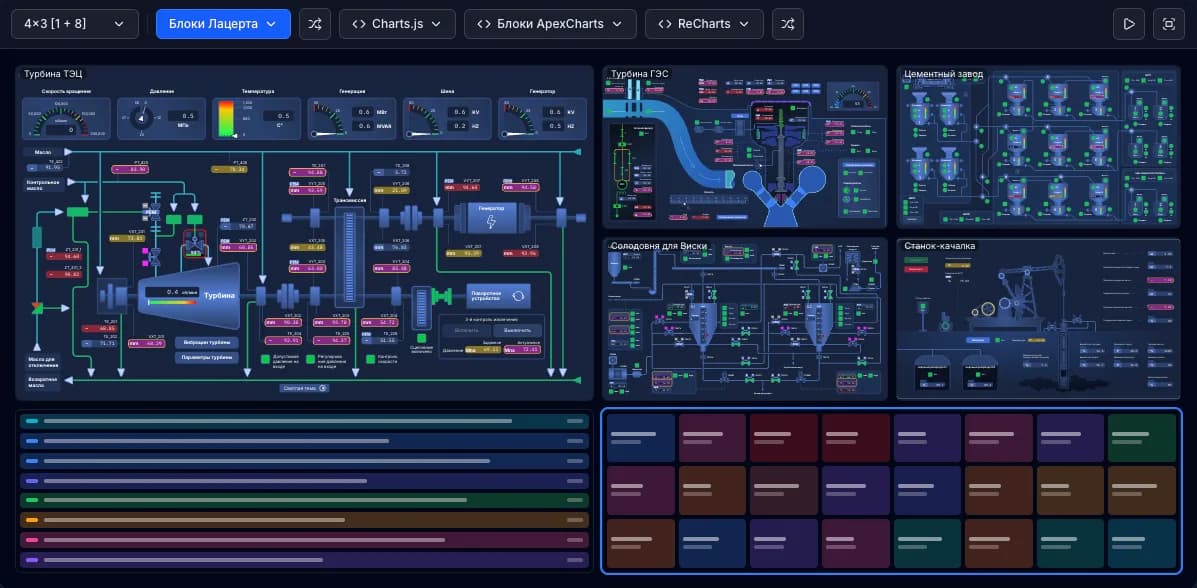
- Grid layout of several HMI screens and blocks
- Can include external components via iFrame and TypeScript
- Support for large monitors
How to bind data
Model-based binding of HMI screens to data — in one click
- Binding of HMI screen components is based on models
- A component can mirror the data structure of a model
- When the component and object models match, binding happens automatically
- This way an entire HMI screen can be bound to data
- In a single action when the models match
How to program HMI screens and widgets
Scripting editor for HMI screens and widgets
Designed for creating, editing and debugging code that works with graphical elements.
- Processing data of HMI screens and widgets
- Reactivity support
- Animation of graphical elements
- Syntax highlighting
- TypeScript support
- Working with external data via REST
Composite HMI screens
Extending the functionality of standard HMI screens
A single canvas from many sources
Assembles several HMI screens, widgets and external sources into one large scheme.
- Layout via the grid editor for large screens, video walls and shared-use stands
- Ready-made layout presets and free grid editing
- Embedding an external web application into a cell (iframe)
- Connecting data and elements from a third-party system (script)
HMI screens and widgets
Standard elements, widgets and nested HMI screens in cells.
Inline Frame
Embedding external web applications using an iframe.
Script
Embedding external web applications using TypeScript.
Browser
The platform runs in modern browsers.
- Yandex Browser
- Google Chrome
- All based on the Chromium engine
- Available to clients without installation
Thick client
The functionality is available in the thick client.
- Does not require a browser
- For a single monitor
- For multi-monitor systems
- Controller for managing shared-use screens
Thick client
Operator workstation
The operator's working application.
- Platform application
- Does not require a browser
- Requires installation
- Embedded support
- Support for shared-use panels
- Support for Linux, Mac, Windows
- Built with C++/Qt, we will build it anywhere
Video wall controller
Management of large shared-use screens.
- Centralized control of the wall
- Support for docked and free windows
- Composing a layout on your own monitor
- Deploying layouts across different video panels
- Support for different modes
- Interactive (dozens of screens)
- Pool snapshots (hundreds of screens)